Produced by Lattice Publishing
Published by The Center Square
May 27, 2020
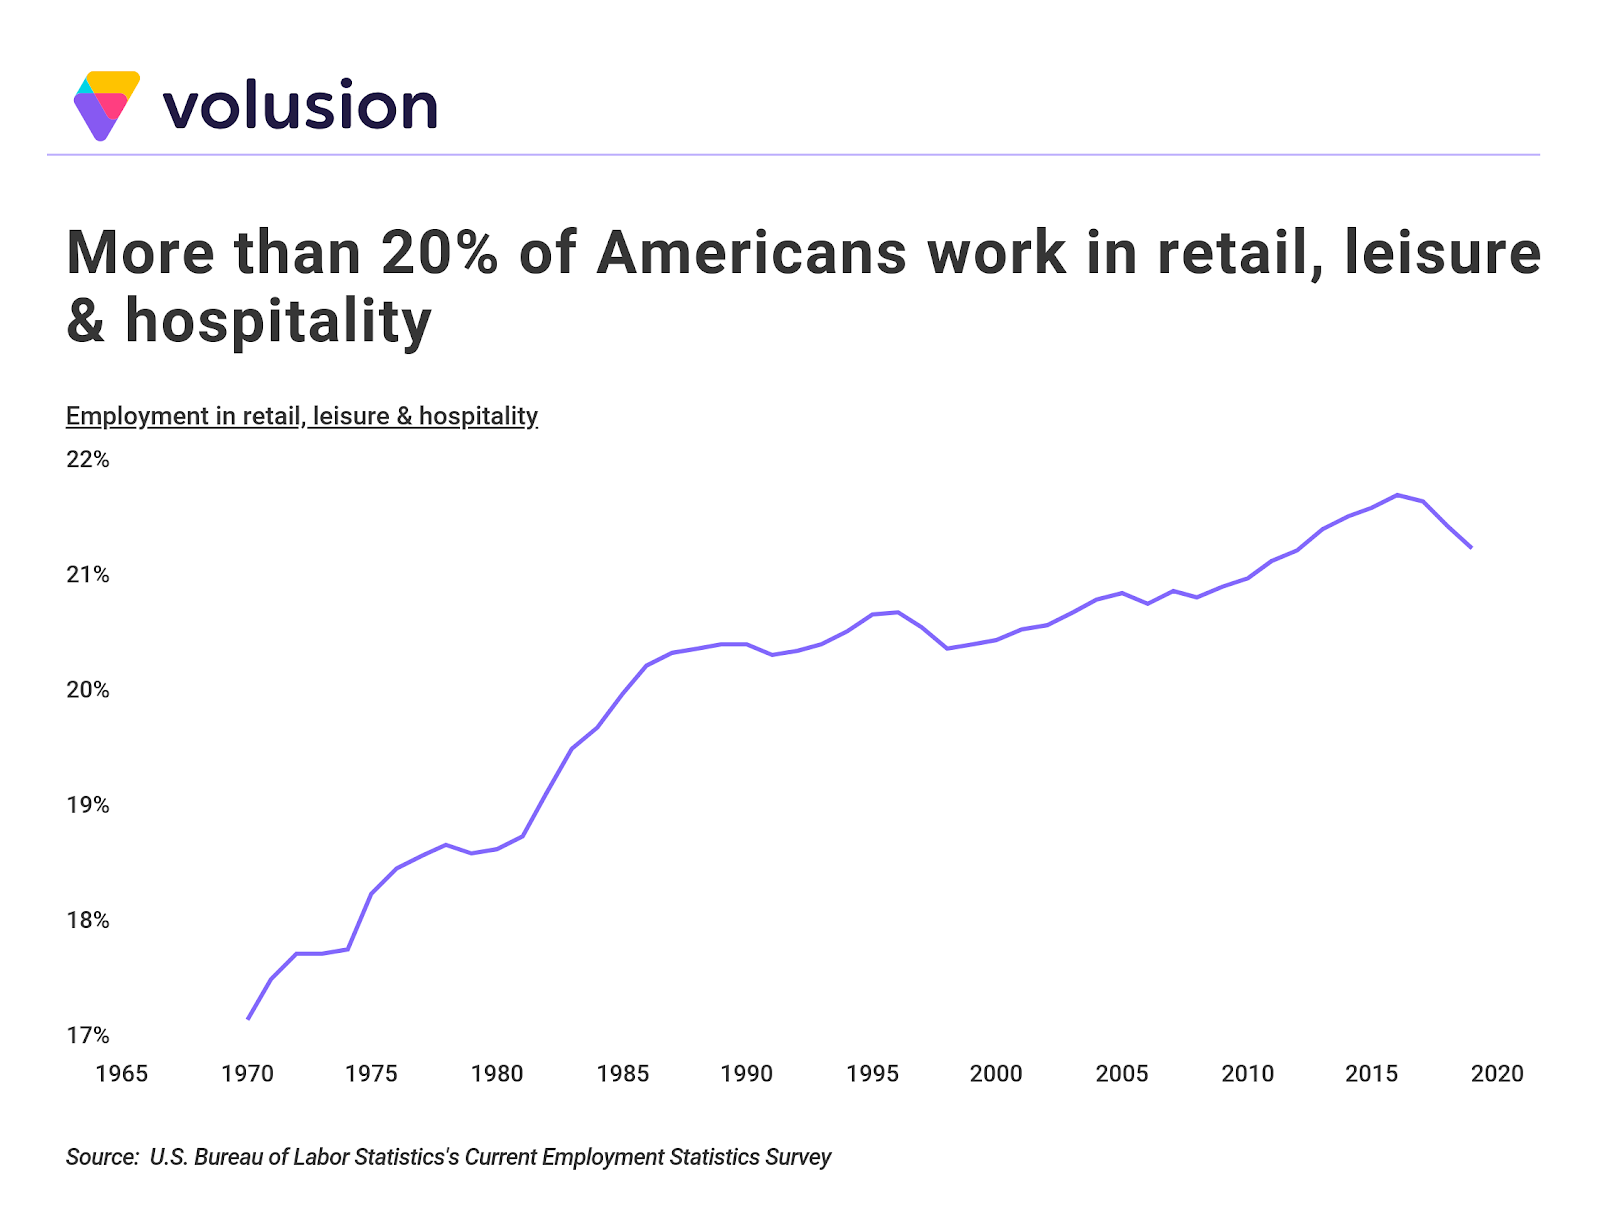
The coronavirus pandemic has led to an unprecedented economic shutdown as thousands of “nonessential” businesses have closed their doors. The crisis disproportionately affects the 21.3% of American workers in retail, leisure, and hospitality who not only face lack of work, but also suffer from long-standing, below-average wages. According to the latest annual data from the Bureau of Labor Statistics, the average hourly wage for workers in the retail trade and leisure and hospitality sectors was $19.70 and $16.55 in 2019, compared to $28 per hour across all workers.
Overall, the share of workers in retail, leisure, and hospitality increased steadily from 1970 to 2016 when it peaked at 21.8%. This trend was largely driven by an increasing share of employment in restaurants and bars, while employment in retail stagnated. Even though the last few years have seen a modest decline in the share of workers in these two sectors overall, more than one-fifth of all U.S. workers were employed in either retail trade or leisure and hospitality in 2019, totalling over 32 million workers.
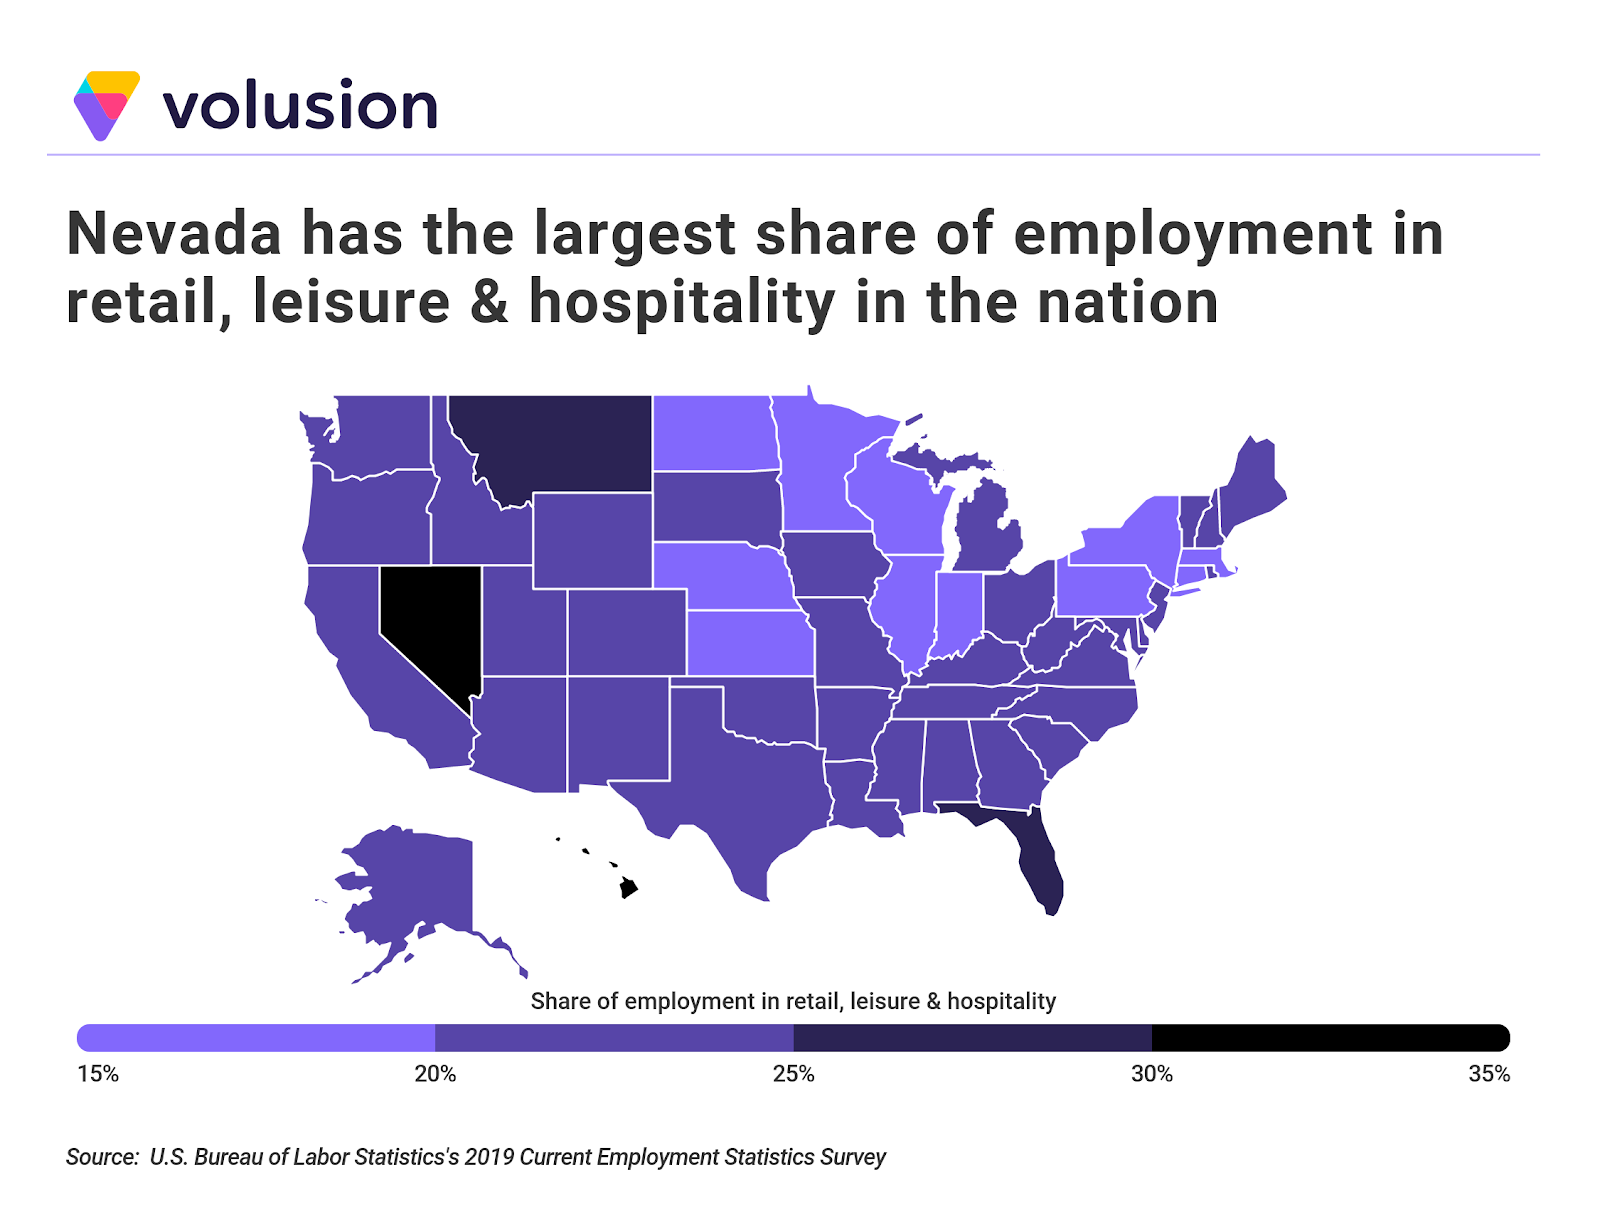
The share of employment in these industries varies widely across cities and states based on local economic conditions and levels of tourism. Nevada and Hawaii lead the nation in the share of employment in retail, leisure, and hospitality at 35.5% and 30.1%, respectively. At the low end, Kansas and Minnesota both have about 19% of their workforce employed in these sectors.
To find the locations with the workforces most impacted by COVID-19, researchers at Volusion used data from the Bureau of Labor Statistics, the Bureau of Economic Analysis, and the U.S. Census Bureau. The researchers ranked metro areas according to the share of workers employed in the retail trade and leisure and hospitality industries. Researchers also looked at the total number of retail trade workers, the total number of leisure and hospitality workers, the cost of living, and the percent of residents below the poverty level.
To improve relevance, only metropolitan areas with at least 100,000 people were included in the analysis. Additionally, metro areas were grouped into the following cohorts based on population size:
- Small metros: 100,000-349,999
- Midsize metros: 350,000-999,999
- Large metros: 1,000,000 or more
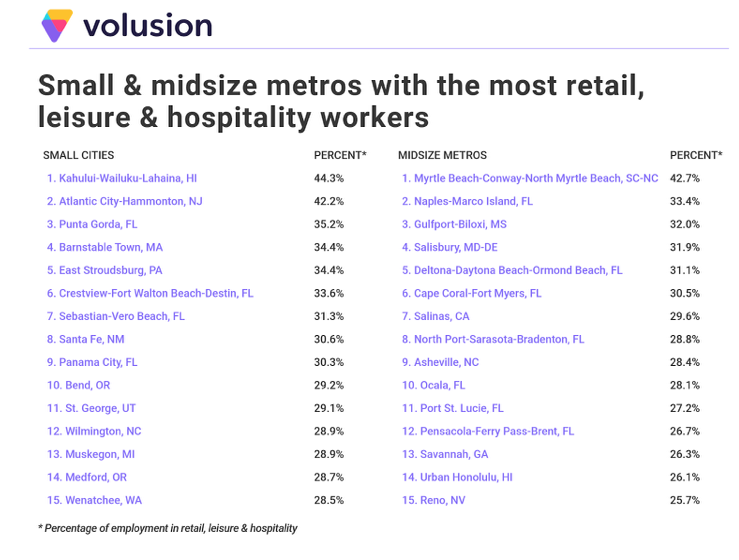
Here are the metropolitan areas with the largest share of employment in retail, leisure, and hospitality, making their workforces especially vulnerable during the coronavirus pandemic.
15 Large Metros With the Most Retail, Leisure & Hospitality Workers

Photo Credit: Alamy Stock Photo
15. Austin-Round Rock-Georgetown, TX
- Share of employment in retail, leisure & hospitality: 21.9%
- Total retail workers: 109,200
- Total leisure & hospitality workers: 135,600
- Cost of living: 0.5% above average
- Percent below the poverty level: 11.2%

Photo Credit: Alamy Stock Photo
14. Charlotte-Concord-Gastonia, NC-SC
- Share of employment in retail, leisure & hospitality: 22.1%
- Total retail workers: 128,800
- Total leisure & hospitality workers: 144,000
- Cost of living: 6.2% below average
- Percent below the poverty level: 11.2%

Photo Credit: Alamy Stock Photo
13. Tucson, AZ
- Share of employment in retail, leisure & hospitality: 22.2%
- Total retail workers: 41,700
- Total leisure & hospitality workers: 44,600
- Cost of living: 4.9% below average
- Percent below the poverty level: 16.2%

Photo Credit: Alamy Stock Photo
12. Raleigh-Cary, NC
- Share of employment in retail, leisure & hospitality: 22.2%
- Total retail workers: 70,500
- Total leisure & hospitality workers: 73,800
- Cost of living: 3.8% below average
- Percent below the poverty level: 8.9%
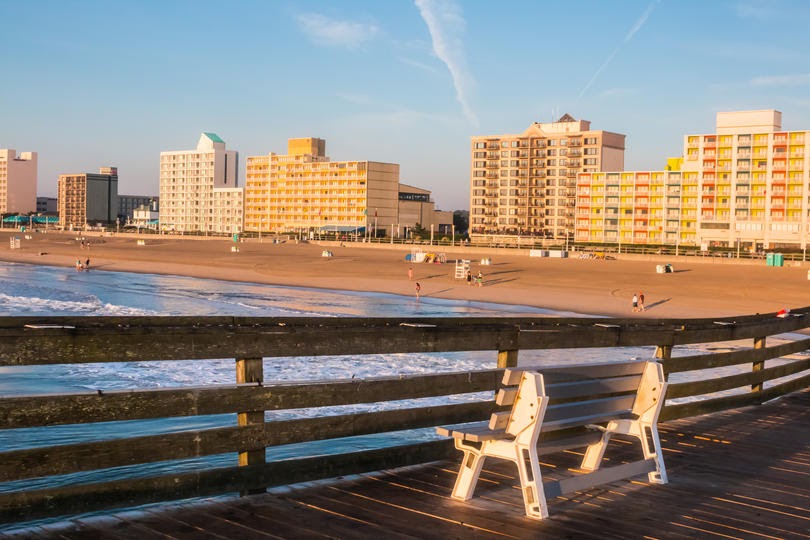
Photo Credit: Alamy Stock Photo
11. Virginia Beach-Norfolk-Newport News, VA-NC
- Share of employment in retail, leisure & hospitality: 22.3%
- Total retail workers: 85,100
- Total leisure & hospitality workers: 92,500
- Cost of living: 2.4% below average
- Percent below the poverty level: 11.2%

Photo Credit: Alamy Stock Photo
10. Providence-Warwick, RI-MA
- Share of employment in retail, leisure & hospitality: 22.4%
- Total retail workers: 64,300
- Total leisure & hospitality workers: 69,900
- Cost of living: 0.3% below average
- Percent below the poverty level: 12.1%
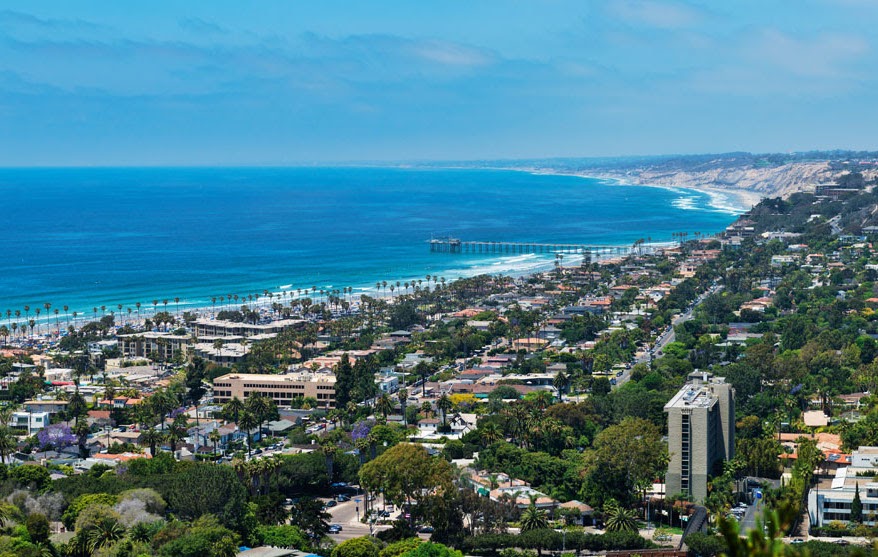
Photo Credit: Alamy Stock Photo
9. San Diego-Chula Vista-Carlsbad, CA
- Share of employment in retail, leisure & hospitality: 23.1%
- Total retail workers: 145,400
- Total leisure & hospitality workers: 202,400
- Cost of living: 16.0% above average
- Percent below the poverty level: 11.4%

Photo Credit: Alamy Stock Photo
8. Riverside-San Bernardino-Ontario, CA
- Share of employment in retail, leisure & hospitality: 23.1%
- Total retail workers: 181,300
- Total leisure & hospitality workers: 175,200
- Cost of living: 7.2% above average
- Percent below the poverty level: 13.7%

Photo Credit: Alamy Stock Photo
7. Tampa-St. Petersburg-Clearwater, FL
- Share of employment in retail, leisure & hospitality: 23.2%
- Total retail workers: 158,400
- Total leisure & hospitality workers: 163,200
- Cost of living: 1.1% below average
- Percent below the poverty level: 13.4%

Photo Credit: Alamy Stock Photo
6. Jacksonville, FL
- Share of employment in retail, leisure & hospitality: 23.3%
- Total retail workers: 82,000
- Total leisure & hospitality workers: 86,800
- Cost of living: 4.6% below average
- Percent below the poverty level: 12.2%

Photo Credit: Alamy Stock Photo
5. San Antonio-New Braunfels, TX
- Share of employment in retail, leisure & hospitality: 23.4%
- Total retail workers: 113,600
- Total leisure & hospitality workers: 138,800
- Cost of living: 5.6% below average
- Percent below the poverty level: 15.4%
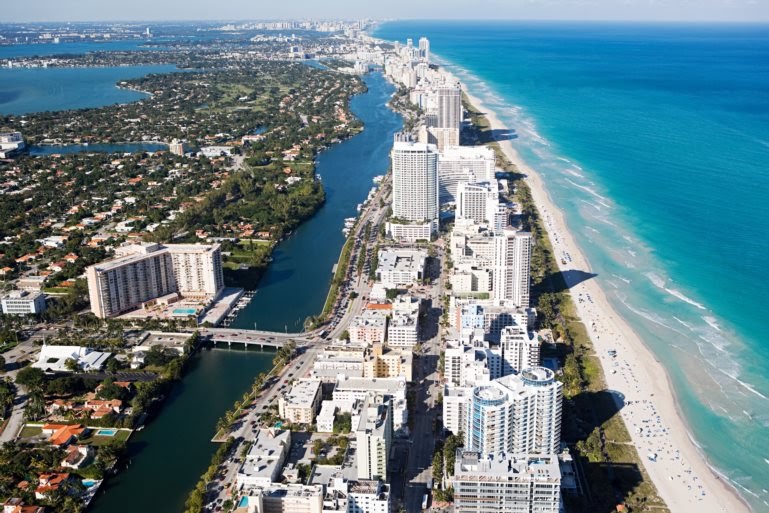
Photo Credit: Alamy Stock Photo
4. Miami-Fort Lauderdale-Pompano Beach, FL
- Share of employment in retail, leisure & hospitality: 24.6%
- Total retail workers: 335,700
- Total leisure & hospitality workers: 332,900
- Cost of living: 8.4% above average
- Percent below the poverty level: 14.0%

Photo Credit: Alamy Stock Photo
3. New Orleans-Metairie, LA
- Share of employment in retail, leisure & hospitality: 26.1%
- Total retail workers: 60,400
- Total leisure & hospitality workers: 91,800
- Cost of living: 4.8% below average
- Percent below the poverty level: 17.5%

Photo Credit: Alamy Stock Photo
2. Orlando-Kissimmee-Sanford, FL
- Share of employment in retail, leisure & hospitality: 32.1%
- Total retail workers: 150,600
- Total leisure & hospitality workers: 275,800
- Cost of living: 1.7% below average
- Percent below the poverty level: 13.9%

Photo Credit: Alamy Stock Photo
1. Las Vegas-Henderson-Paradise, NV
- Share of employment in retail, leisure & hospitality: 39.0%
- Total retail workers: 109,300
- Total leisure & hospitality workers: 294,100
- Cost of living: 2.5% below average
- Percent below the poverty level: 13.9%
Detailed Findings & Methodology
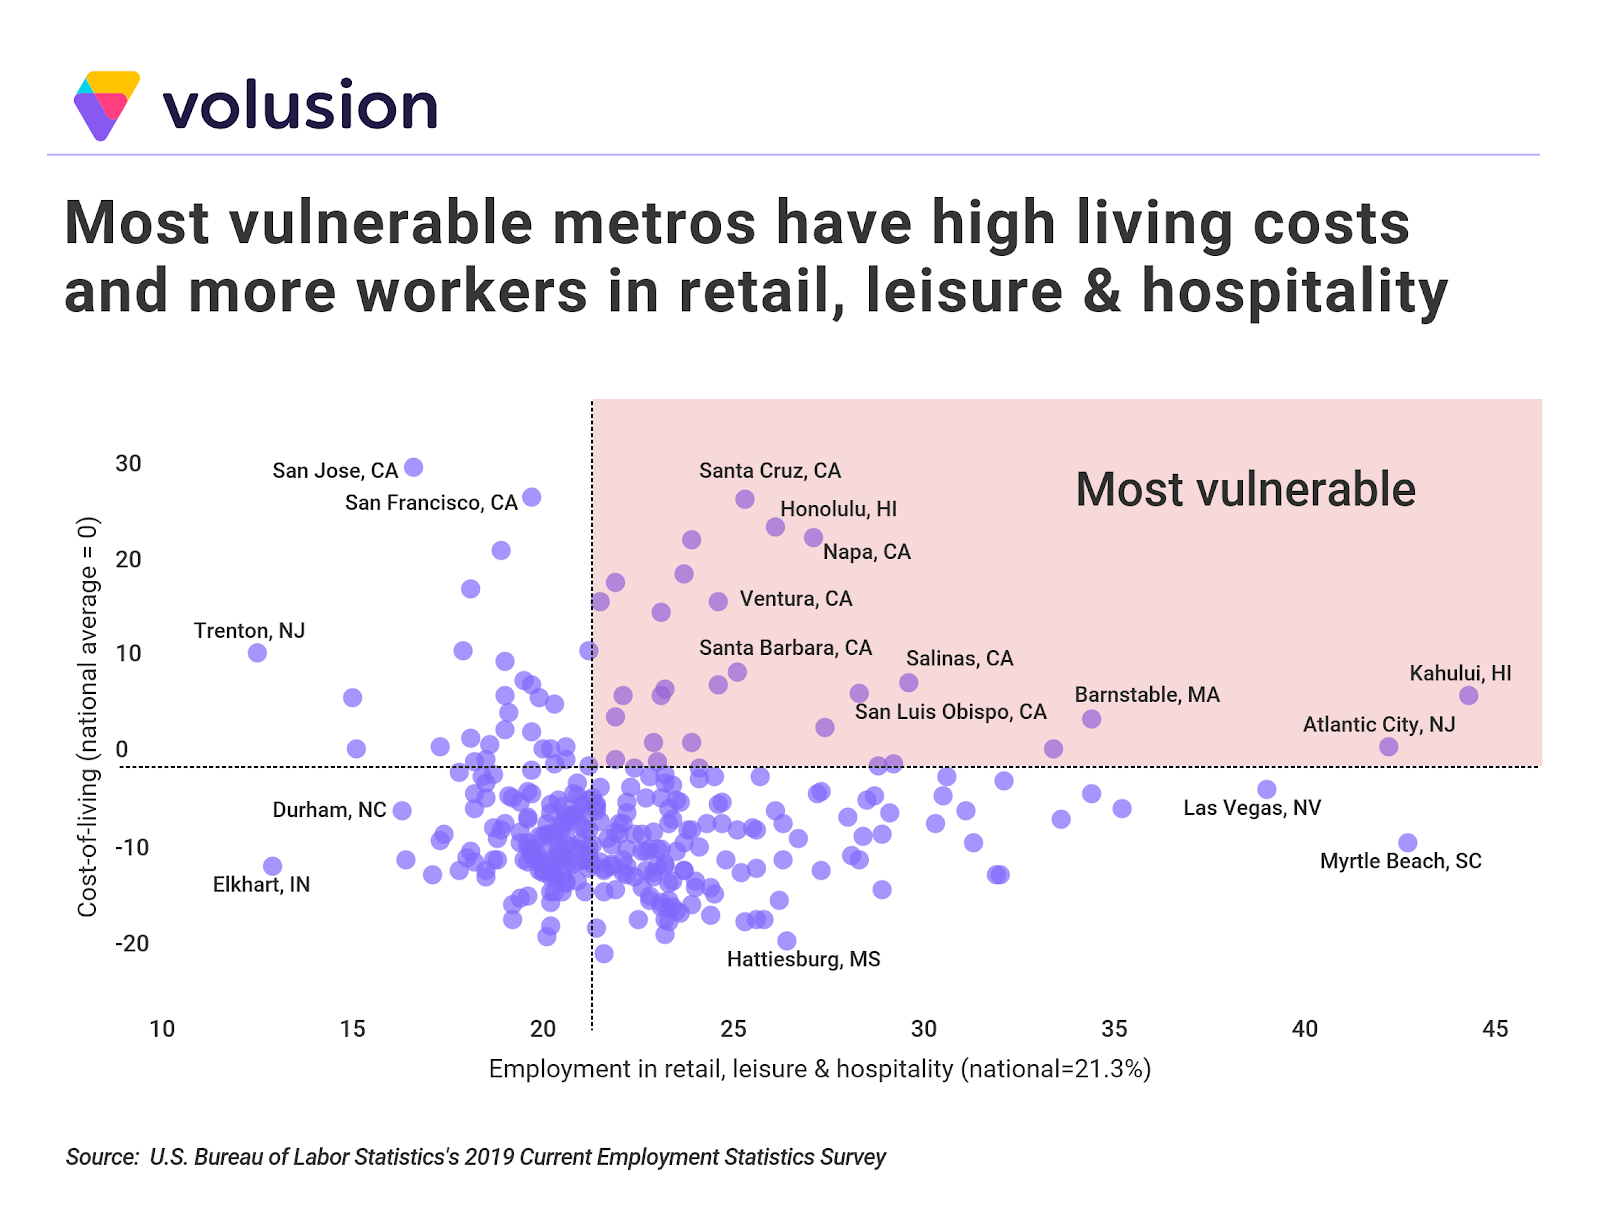
Tourist destinations dominate the metropolitan areas with the largest share of employment in retail, leisure, and hospitality. With employment shares well above the national level of 21.3% these metros face a greater impact during the economic shutdown. Thousands of retail, leisure, and hospitality workers in these metros have lost their jobs or had their hours reduced.
While cost of living is not correlated with the share of employment in retail, leisure, and hospitality, workers in these industries who also live in expensive areas are especially vulnerable. Many desirable California communities with service-driven economies fall into this bucket, including San Diego, Santa Cruz, Napa, Salinas, Santa Barbara, San Luis Obispo, and Ventura, among others.
To determine the metros with workforces most impacted by the coronavirus pandemic, researchers at Volusion analyzed the latest data from the Bureau of Labor Statistics’s 2019 Current Employment Survey(CES), the Bureau of Economic Analysis’s 2017 Regional Price Parity (RPP) dataset, and the U.S. Census Bureau’s 2018 American Community Survey (ACS). Using CES data, the researchers ranked metros according to the share of nonfarm employment in the retail trade and leisure and hospitality industries. In the event of a tie, the metro with the larger number of retail, leisure, and hospitality workers was ranked higher. The cost of living comes from the RPP dataset, and the percent of residents below the poverty level is from the ACS.